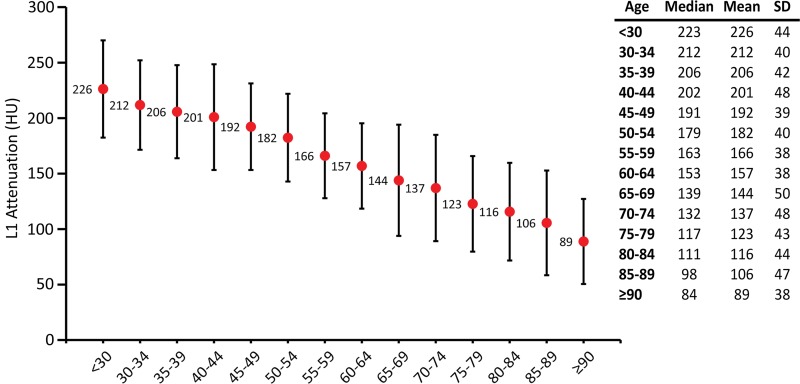
Figure 3:
Plot shows normative reference values for trabecular L1 attenuation values for opportunistic osteoporosis screening. The median and the mean ± standard deviation (SD) values for L1 trabecular attenuation in Hounsfield units are shown for each age group (x-axis). The plot of the mean Hounsfield units (red dots) shows that age-related L1 trabecular bone loss is fairly linear. The normative reference ranges can serve as a quick reference while performing CT examination for other clinical indications. Error bars indicate standard deviations, which are fairly uniform across the age spectrum.

