
Figure 2.
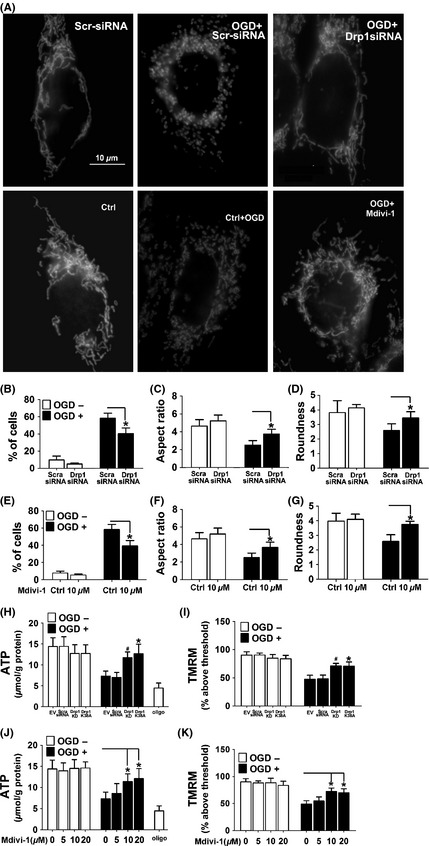
Mdivi‐1 reversed the morphological and functional changes of mitochondria induced by OGD. (A) SH‐SY‐5Y cells were transfected with Drp1 siRNA (upper panel) or pretreated with Mdivi‐1 (lower panel) before being labeled with Mito Ds‐Red. Shown are representative images. Scale bars = 10 μm. (B,E) Percentage of cells with truncated or fragmented mitochondria in cells treated with Drp1 RNAi or Mdivi‐1. Quantification was performed in a blinded manner from more than 200 cells in 10 randomly chosen 200× microscopic fields in three independent experiments. (C,D,F,G) Quantification of different morphological mitochondria from the cells with different treatments was indicated. Data are mean ± SD from 10 to 15 randomly selected cells in three independent experiments, P < 0.05 vs. scramble‐siRNA or vehicle‐treated control. (H,J) Cellular ATP levels were assessed by HPLC. (I,K) SH‐SY‐5Y cells were subjected to OGD and mitochondrial membrane potential (Δψm) was measured using the fluorescent cationic dye TMRM. Data are mean ± SD from six independent experiments. *P < 0.05 vs. empty vector, # P < 0.05 vs. scramble‐siRNA group (H,I), *P < 0.05 vs. vehicle‐treated control (J,K).