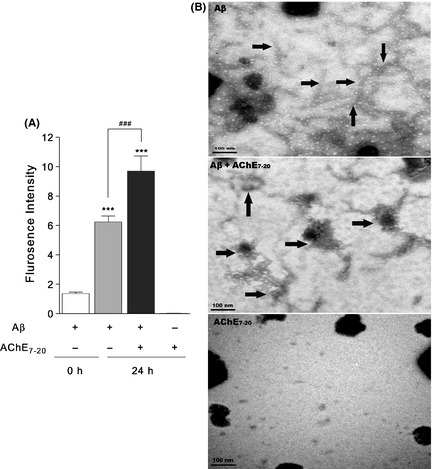
Figure 5.

AChE 7–20 induced Aβ aggregation and deposition. (A) ThT assay of AChE 7–20 induced Aβ aggregation. Solution of 125 μM Aβ in the presence and absence of 1.25 μM AChE 7–20 were incubated 0.215 M PB (pH 8.0) at 37°C for 24 h. Solutions were diluted with 10 μM ThT, and the fluorescence was monitored on Varioskan Flash at an excitation of 446 nm and emission of 490 nm. Data are the mean values ± SEM (n = 4). ***P < 0.001, # # # P < 0.001. (B) Demonstration of the effects of AChE 7–20 induced Aβ deposition by TEM. 230 μM Aβ or 2.3 μM AChE 7–20 was incubated alone, or co‐incubated for 7 days at 37°C. Samples were dropped into grids and immediately stained with 3.5% filtered phosphotungstic acid. Arrows indicate Aβ fibrils and senile plaques respectively. The morphologies were imaged by Hitachi H7650 TEM at 80 kV. The scale bars represent 100 nm.
