
Figure 1.
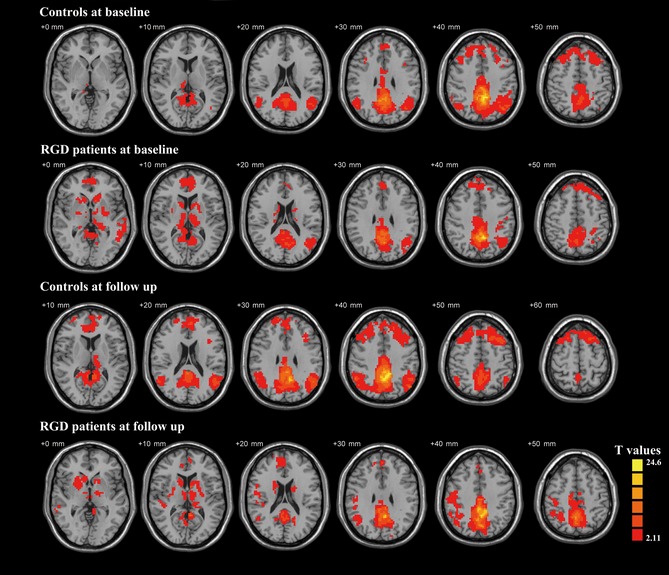
The one‐sample t‐test images show the functional connectivity of PCC in RGD patients and controls at baseline and follow‐up, which indicate the DMN patterns. Thresholds were set at a corrected P < 0.05.
Official websites use .gov
A
.gov website belongs to an official
government organization in the United States.
Secure .gov websites use HTTPS
A lock (
) or https:// means you've safely
connected to the .gov website. Share sensitive
information only on official, secure websites.
The one‐sample t‐test images show the functional connectivity of PCC in RGD patients and controls at baseline and follow‐up, which indicate the DMN patterns. Thresholds were set at a corrected P < 0.05.