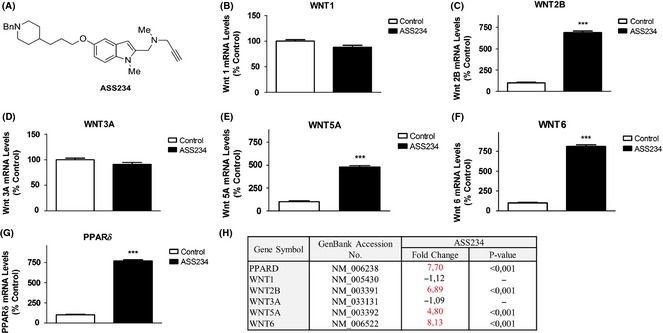
Figure 1.

(A) Represents chemical structure of ASS234. (B–G) Shows results from real‐time PCR arrays targeting select genes after ASS234 (5 μM) treatment. (H) Representative table of data, in which specific gene expression was compared with controls [cells treated with DMSO (0.1%) were the negative control]. Each bar represents mean ± SEM of six independent experiments. ACTB was used as an internal control. ***P < 0.001, significantly different from controls.
