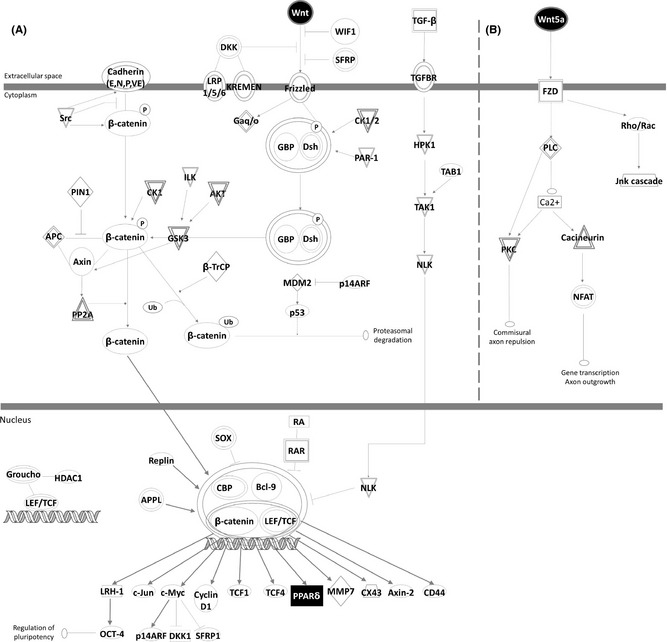
Figure 2.

Ingenuity Pathway Analysis (IPA) of ASS234 treatment. (A) The canonical Wnt/β‐catenin pathway. (B) The noncanonical Wnt/PCP and Wnt/Ca2+ pathways. The genes that are shaded were determined to be significant from the statistical analysis. A solid line represents a direct interaction between the two gene products, and a dotted line means there is an indirect interaction. Black represents up‐regulated genes, and white represents not studied genes.
