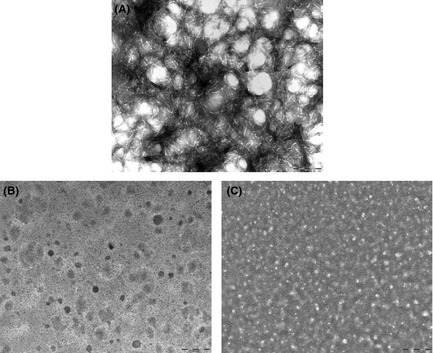
Figure 2.

Transmission electron microscopy images: (A) 100 μM Aβ 1–42; (B) 100 μM Aβ 1–42 co‐incubated with 2a (50 μM); (C) preformed Aβ 1–42 fibrils after incubation with 2a (50 μM). Images are taken at t = 5 day and are representative of those obtained for each of at least two replicates. Scale bar: 200 nm, magnification 60,000x.
