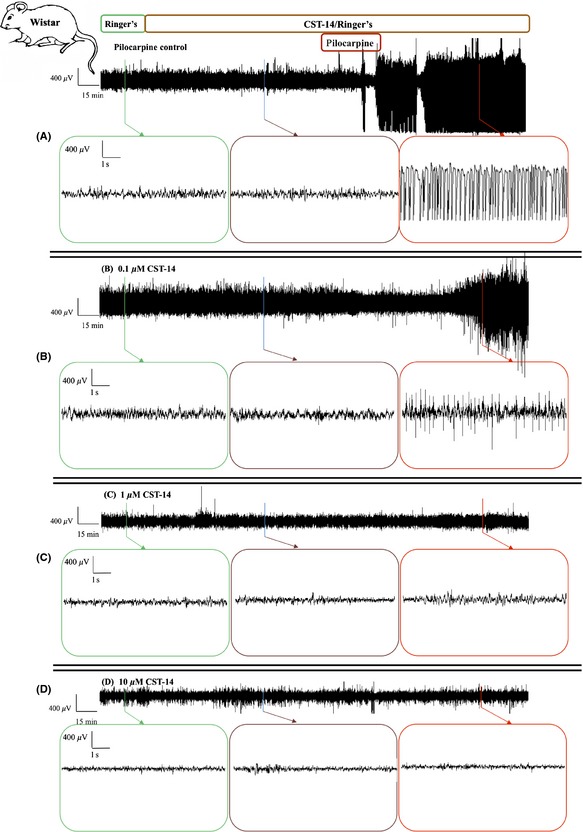
Figure 1.

The sample time courses of in vivo ECoG recordings in rats. Representative ECoG recordings of (A) a control experiment, an experiment where the effect of (B) 0.1 μM CST‐14, (C) 1 μM CST‐14 and (D) 10 μM CST‐14 was examined. Each ECoG recording represents 30 min of baseline, 2 h of CST‐14 or Ringer's (pilocarpine control) perfusion, 40 min of co‐perfusion with pilocarpine and again 100 min of CST‐14 or Ringer's perfusion alone.
