
Figure 5.
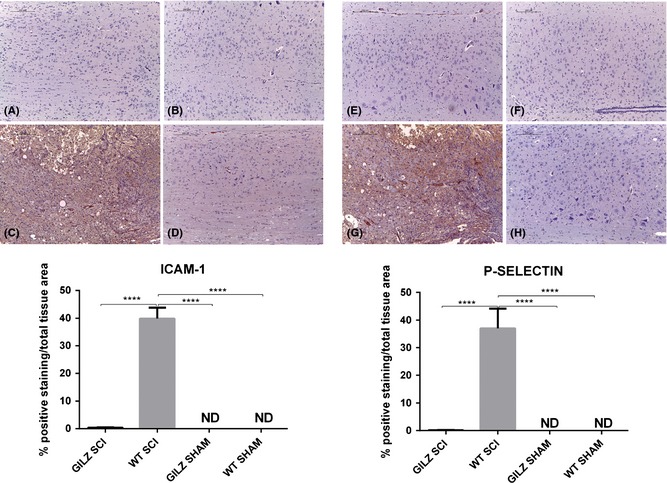
Reduced ICAM‐1 and P‐selectin positive cells in gilz KO compared with WT in spinal cord after SCI. ICAM‐1 and P‐selectin expression in spinal cord after SCI. Immunohistochemical analyses show that both ICAM‐1 and P‐selectin expression in perilesional area of spinal cord is reduced in gilz KO SCI compared with WT SCI mice. Scale bars 200 μm, 10X. ICAM‐1 staining: (A) Sham WT; (B) Sham gilz KO; (C) WT SCI; (D) gilz KO SCI. P‐selectin staining: (E) Sham WT; (F) Sham gilz KO; (G) WT SCI; and (H) gilz KO SCI. In the bottom graphs are represented the densitometric analysis to quantify and highlight significant differences among experimental groups. For each staining, results are expressed as “% of positive staining” calculated on the mean of at least n = 3 acquired IHC image/group. ****P < 0.0001, Bonferroni test.