
Figure 2.
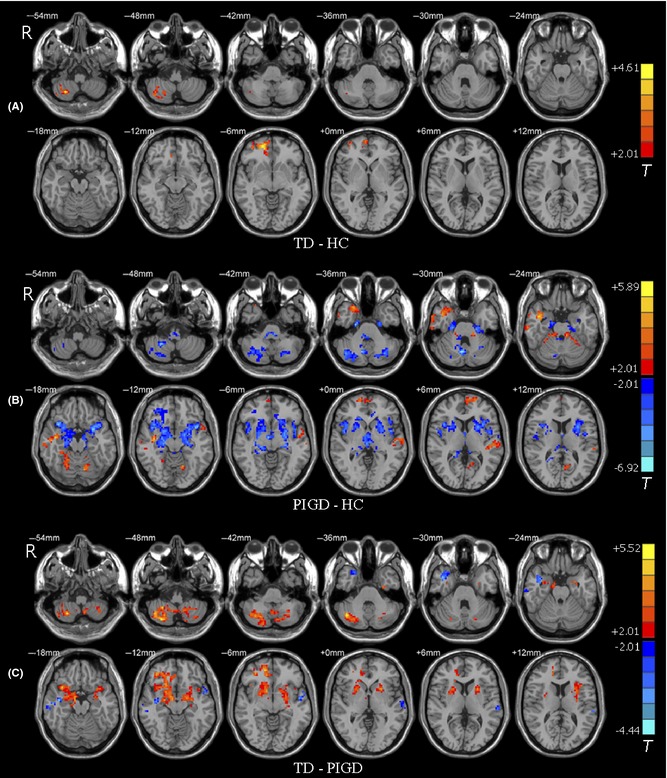
Brain maps for between‐group differences in ALFF values. The statistical threshold was set at P < 0.05 and cluster size >72 voxels, which corresponds to a corrected P < 0.05. (A) TD group had higher ALFF values in the right cerebellar lobule VIII and the right prefrontal cortex than HC. Of note, lower ALFF values in the vermis VIII survived the height threshold, but not the extent threshold. (B) ALFF differences between PIGD and HC groups. (C) ALFF differences between the TD and PIGD groups. The left side of the image corresponds to the right side of the brain in axial orientation; slice coordinates according to MNI space are shown in the upper right corner of the slices, indicating Z‐axis in axial orientation. For details of the regions, see Table 2.