
Figure 4.
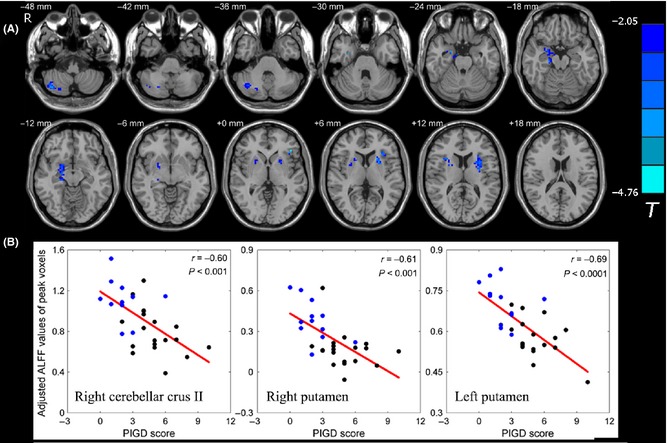
Correlation of ALFF values with PIGD score in patients with PD. (A) Correlation maps of PIGD score with ALFF values in patients with PD. The statistical threshold was set at P < 0.05 and cluster size >49 voxels, which corresponds to a corrected P < 0.05. (B) Scatter plot of ALFF values of peak voxels versus the PIGD score of patients with PD. The black dots represent the patients with PIGD, and the blue dots represent the patients with TD.