Figure 5.

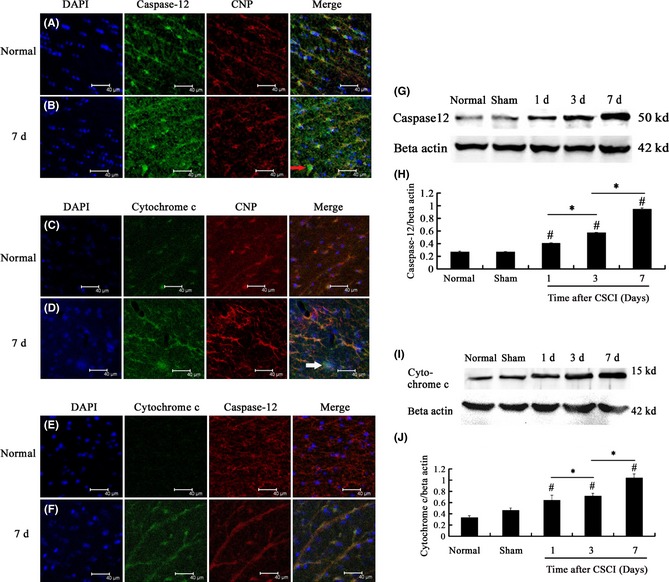
(A, B) Double‐labeling immunofluorescence of caspase‐12 and CNPase, an oligodendrocyte marker, in the white matter of the spinal cord of rats in different groups. Scale bar = 40 μm. (C, D) Double‐labeling immunofluorescence of cytochrome c and CNPase in the white matter of rats in different groups. Scale bar = 40 μm. (E, F) Double‐labeling immunofluorescence of caspase‐12 and cytochrome c in the white matter of the spinal cord at the lesion. Scale bar = 40 μm. (G, H) Caspase‐12 protein expression at the corresponding time examined by Western blot. Caspase‐12 protein expression at the corresponding time in the compressed spinal cord injury (CSCI) group was significantly higher than that in normal and sham groups and reached the maximum on the 7th day after CSCI. (I, J) Cytochrome c protein expression at the corresponding time examined by Western blot. Cytochrome c protein expression at the corresponding time in CSCI group was significantly higher than that in normal and sham groups. This expression reached the maximum at 7 days after CSCI. Data represent mean ± SEM (n = 3 per group). Two‐way ANOVA was performed followed by LSD
post hoc tests where appropriate. #
P < 0.05 compared with the sham group; *P < 0.05, compared with CSCI group. ( ): Caspase‐12‐positive oligodendrocytes. (
 ): Cytochrome c‐positive oligodendrocytes.
