
Figure 5.
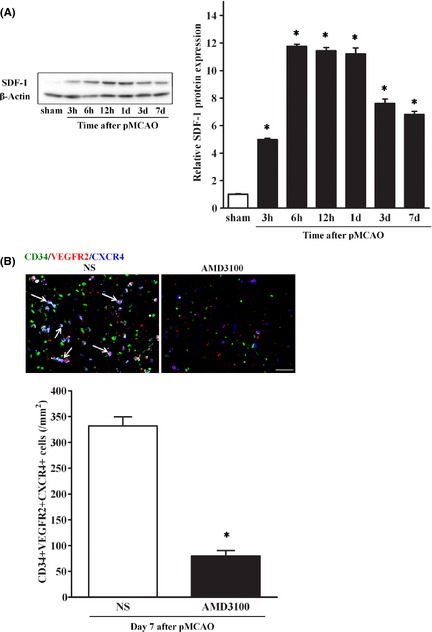
Recruitment of endogenous EPCs via CXCR4/SDF‐1 axis after pMCAO. (A) Western blotting showed SDF‐1 expression in IBZ after pMCAO, with β‐actin serving as an internal control. SDF‐1 expression was significantly increased 3 h after pMCAO, further elevated at 6 h, lasting for 1 day, and then decreased slowly at day 3 and day 7. n = 3–4/group. Data are expressed mean ± SD, *P < 0.05, versus. sham‐operated group. (B) After treatment with AMD3100, combination staining showed CXCR4‐positive EPCs in IBZ at day 7 after pMCAO were significantly less in AMD3100 group than in normal saline group. Scale bar = 20 μm. n = 5–6/group. *P < 0.05, versus. normal saline group.