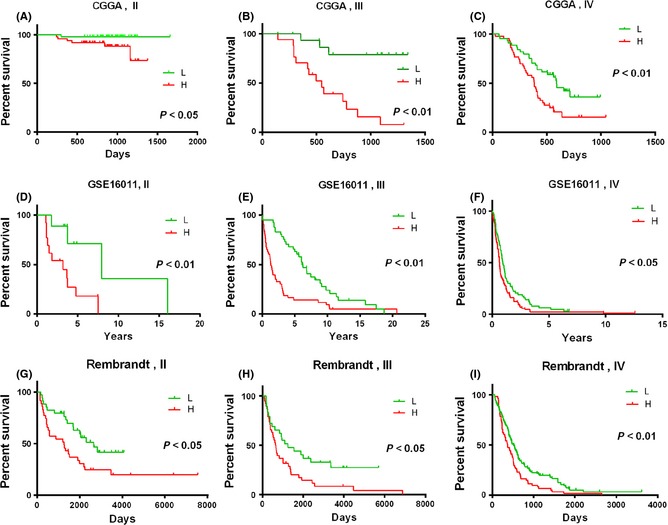
Figure 1.

These Kaplan–Meier estimates of overall survival in patients with each grade glioma were constructed by the signature. P‐values are indicated for the high‐risk and low‐risk groups stratified according to the signature risk score in the Chinese Glioma Genome Atlas (CGGA) data (A, B, and C), the GSE16011 data (D, E, and F), and the Rambrandt data (G, H, and I). H, high‐risk group; L, low‐risk group.
