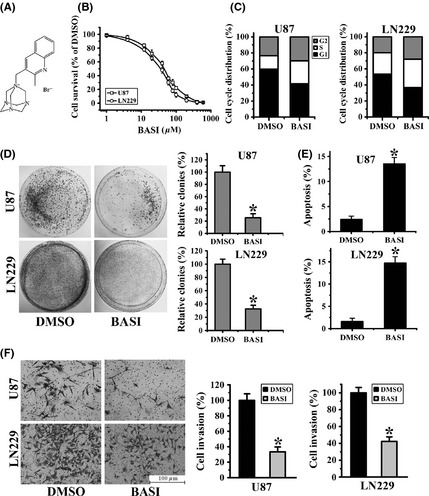
Figure 1.

BASI inhibits glioma cells growth and invasion. (A) The chemical structure of BASI. (B) U87 and LN229 cells survival at 48 h following treatment with different doses of BASI, as determined by the MTT assay. (C) The cell cycle distribution was detected by flow cytometry after 40 μM BASI treatment. (D) Colony formation assays for U87 and LN229 cells (left). A relative quantification indicating the number of colonies formed by BASI‐treated cells, which was standardized to DMSO‐treated cells (right). (E) Effects of BASI and DMSO on cell apoptosis after 48‐h treatment. (F) Representative micrographs (left) and histograms (right) of transwell assays after treatment with BASI and DMSO. Data represent the mean ± SD of three independent experiments (*P < 0.05).
