
Figure 2.
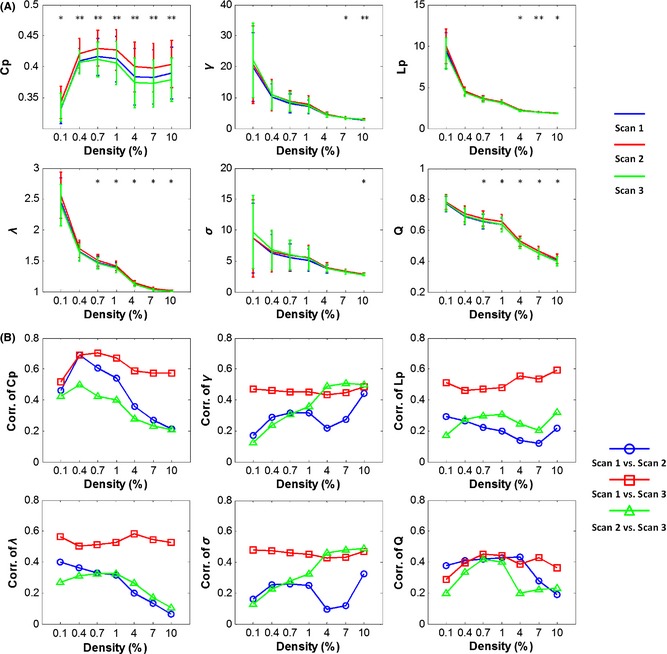
Global metrics and intersubject correlation among different scans at different connectivity densities. (A) Mean values across subjects decreased with an increase in network density for all global metrics except Cp. (B) Correlations of global metrics across subjects between each pair of the three scans. In (A), “*”and “**”denote that at the specific density, a significant difference was found among the three scans at the level of P = 0.01 and the level of P = 0.001, respectively, from a repeated‐measures ANOVA. Cp, clustering coefficient; γ, gamma; σ, sigma; Lp, characteristic path length; λ, lambda; Q, modularity.