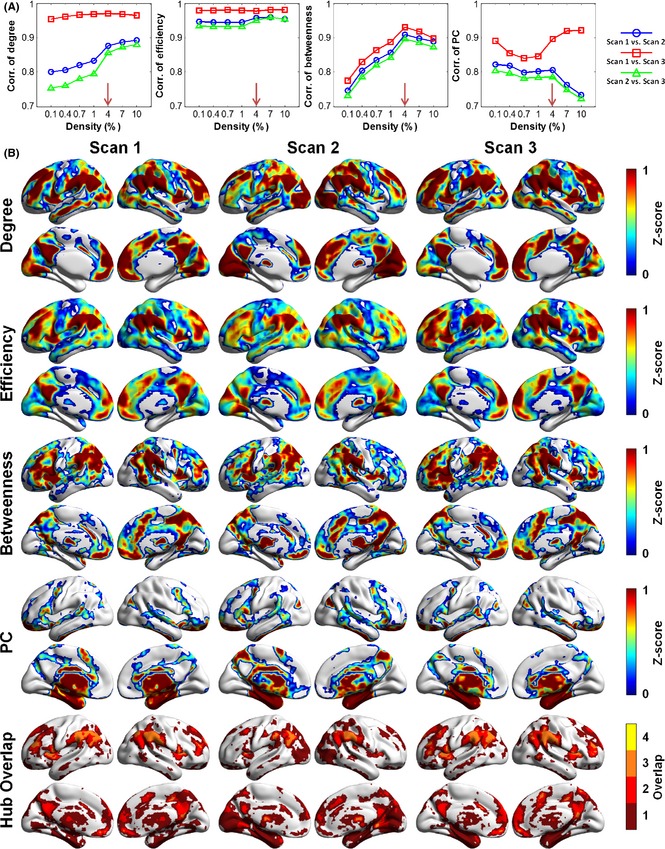
Figure 4.

Voxelwise hub maps and their interscan correlations. (A) The interscan consistency of spatial patterns of functional hubs was the highest at 4.0% density for the four nodal metrics examined. (B) Group‐level voxelwise maps of functional hubs and the overlap of hub regions identified by different metrics at 4.0% density. For each metric, regions with z‐scores above 1 were defined as hubs indicated by the color of dark red. In the last row, colors indicate the number of different types of functional hubs overlapping in an area. The global hubs identified by degree, efficiency, and betweenness showed similar spatial patterns, while the PC detected different connector hub regions at this density. All surface‐based figures are drawn with BrainNet Viewer 70. PC, participation coefficient.
