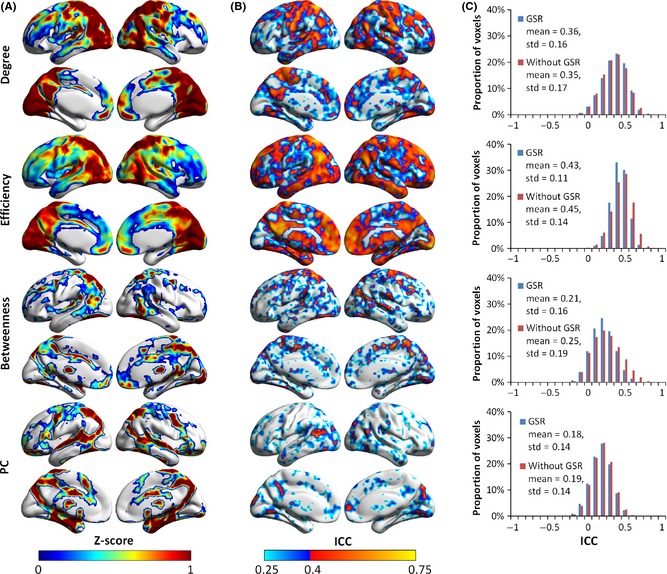
Figure 7.

Group‐level voxelwise functional hub maps and TRT reliability of the nodal metrics based on R‐fMRI data without GSR at the density of 4.0%. (A) Spatial patterns of the four nodal metrics (i.e., degree, efficiency, betweenness, and PC) for Scan 1. (B) Spatial maps of long‐term I reliability of the nodal metrics in the case without GSR. (C) Normalized histograms of ICC values across the brain showed similar results for degree and PC in two cases (i.e., with GSR and without GSR), while the distribution profile of ICC values shifted slightly to the right for efficiency and betweenness. Although the spatial configuration of hub regions and reliability, compared with Figures 4 and 5, showed slight differences for all nodal metrics in (A) and (B), degree and efficiency were also more reliable than betweenness and PC, and most hub regions showed moderate to good reliability for these two metrics, which is compatible with previous results with GSR. GSR, global signal removal; ICC, intraclass correlation coefficient; PC, participation coefficient.
