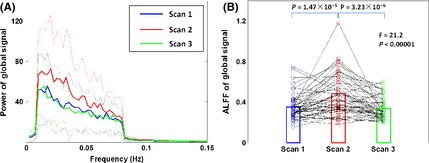
Figure 8.

The power spectrum and amplitude of the low‐frequency fluctuation (ALFF) of global signals. (A) The power spectrums of global signals of the three scans are represented as mean value (solid lines) with standard deviation (dotted lines) across subjects. The Scan 2 showed higher amplitude value in the low‐frequency range than Scan 1 and Scan 3. (B) The changing curve of the ALFF for each subject was illustrated, and the circle represents each scan of each subject. Subsequent statistical analysis revealed significantly higher ALFF of global signals in Scan 2 than the other two scans (P < 0.0001). ALFF, amplitude of low‐frequency fluctuation.
