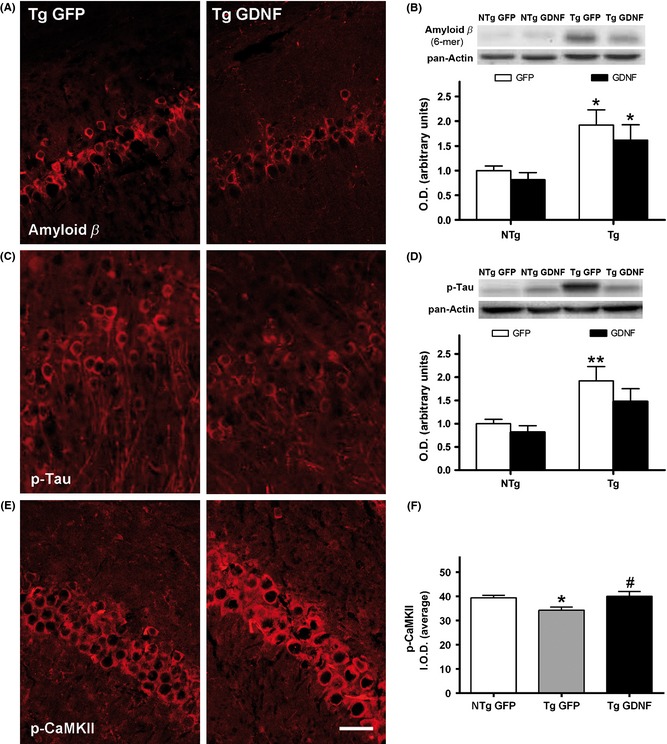
Figure 2.

Amyloid and tau pathology and synaptic plasticity status in the hippocampus of 3xTg‐AD mice (Tg) treated with GFP or GDNF. (A) Representative images of immunostaining of intraneuronal amyloid β deposits in the CA1 pyramidal cell layer. (B) Levels of amyloid β oligomers shown by Western blot of the whole hippocampus in Tg and nontransgenic mice (NTg). (C) Representative images of immunostaining of intraneuronal p‐tau deposits in the CA1 pyramidal cell layer. (D) Levels of p‐tau shown by Western blot of the whole hippocampus. (E) Representative images of immunostaining of p‐CaMKII in the CA1 pyramidal neurons. (F) Intensity of p‐CaMKII staining, see text for details. O.D., optical density of Western blots in (B, D); I.O.D., integrated optical density of neurons in (F). Values are the mean ± SEM, n = 8–9. Statistics: *P < 0.05, **P < 0.01 compared to nontransgenic mice (NTg) with the same treatment; #P < 0.05 compared to Tg‐GFP. Scale bar = 50 μm.
