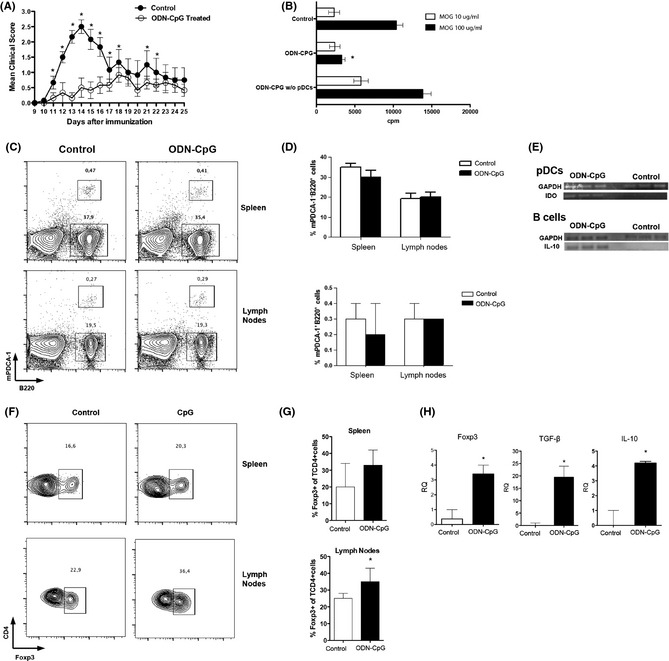
Figure 1.

Clinical evolution of EAE in C57BL/6 mice, which were subcutaneously treated with ODN‐CpG at 5 μg/dose during 5 consecutive (−5 to 0) days (black circle). The control group (white circle) received the same dose of ODN alone during the same period (A). Specific proliferative response of T lymphocytes from lymph nodes of ODN‐CpG treated with or without pDCs and treated with ODN alone (control), and stimulated with 1 (white bars) or 10 μg/mL (black bars) of MOG35–55 peptide (B). Flow cytometry analysis of pDCs (B220+ mPDCA‐1+) and B lymphocytes (B220+ mPDCA‐1−) in spleen and lymph node from CpG‐treated (black bars) and CpG‐untreated (white bars) mice (C, representative plot; D, mean of 5 independent experiments). qPCR of IDO and IL‐10 of sorted pDCs and B cells (RQ = relative quantification) (E). Flow cytometry analysis of CD4+CD25+Foxp3+ (CD25, plot not presented; up to 95% of CD4+Foxp3+ cells) cells in spleen and lymph node from CpG‐treated (black bars) and CpG‐untreated (white bars) mice (F, representative plot; G, mean of five independent experiments). qPCR of Foxp3, IL‐10, and TGFβ of lymph nodes from CpG‐treated (black bars) and CpG‐untreated (white bars) mice (H).
