Figure 2:
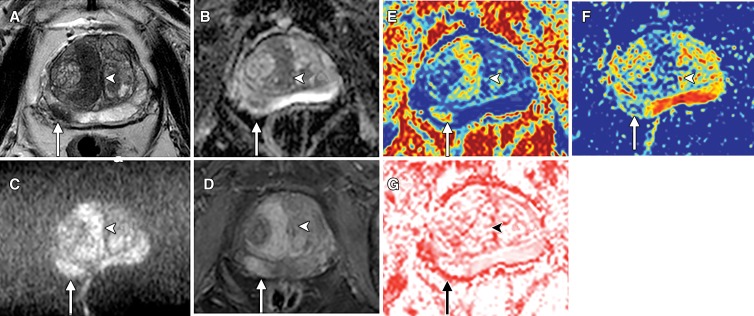
Images in an 82-year-old man with biopsy-proven prostate cancer arising in both the transition zone (arrows) and peripheral zone (arrowheads). A, Axial T2-weighted turbo spin-echo MRI shows lenticular right paramidline transition zone tumor and right peripheral zone tumor at 7 to 8 o’clock. Both have low signal intensity. B, Apparent diffusion coefficient (ADC) map shows that both tumors have reduced ADC. C, MRI obtained with b value of 2000 sec/mm2 shows tumors with high signal intensity. D, Early dynamic MRI obtained with gadolinium-based contrast material shows enhancement of both lesions. E, Axial Vascular, Extracellular, and Restricted Diffusion for Cytometry in Tumors (VERDICT) map of intracellular volume fraction shows tumors with increased intracellular volume fraction. F, VERDICT map of extracellular extravascular volume fraction shows reduction in degree of extracellular extravascular space. G, VERDICT map of vascular volume fraction shows tumors with equivocal-to-low vascular volume fraction values. Methods for determining extracellular extravascular volume fraction and vascular volume fraction, along with the results, are provided in Appendix E1 (online).

