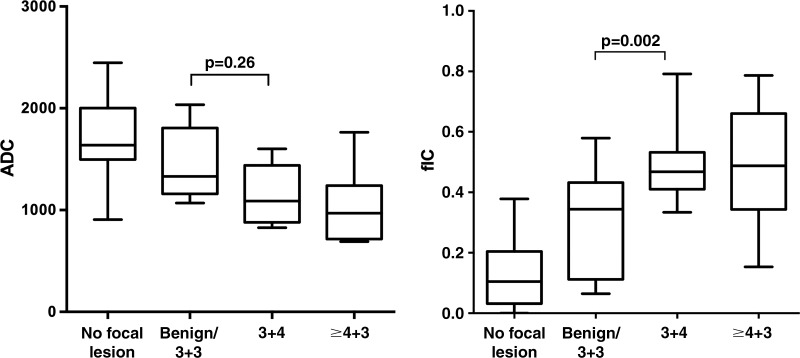
Figure 3:
Box-and-whisker plots show distribution of, left, apparent diffusion coefficient (ADC) (in square millimeters per second) and, right, Vascular, Extracellular, and Restricted Diffusion for Cytometry in Tumors (VERDICT) MRI–determined intracellular volume fraction (fIC) (in fraction of signal, where 1.0 = total signal). Key differences in metrics between benign and/or Gleason grade 3+3 lesions and Gleason grade 3+4 lesions are shown, whereby P = .26 for ADC and P = .002 for intracellular volume fraction. Corrected P values for ADC after Bonferroni correction were as follows: no focal lesion versus benign and/or Gleason grade 3+3 lesions, P = .011; no focal lesion versus Gleason grade 3+4 lesion, P ≤ .001; no focal lesion versus lesions with Gleason grade 4+3 or higher, P ≤ .001; benign and/or Gleason 3+3 lesions versus focal lesions with Gleason grade 3+4, P = .26; benign and/or Gleason grade 3+3 lesions versus focal lesions with Gleason grade of 4+3 or higher, P = .047; and Gleason grade 3+4 lesions versus focal lesions with Gleason grade of 4+3 or higher, P > .99. Corrected P values for intracellular volume fraction after Bonferroni correction were as follows: no focal lesion versus benign and/or Gleason grade 3+3 lesions, P ≤ .001; no focal lesion versus Gleason grade 3+4 lesions, P ≤ .001; no focal lesion versus focal lesions with Gleason grade of 4+3 or higher, P ≤ .001; benign and/or Gleason grade 3+3 lesions versus focal lesions with Gleason grade 3+4, P = .002; benign and/or Gleason grade 3+3 lesions versus focal lesions with Gleason grade of 4+3 or higher, P = .006; and Gleason grade 3+4 lesions versus focal lesions with Gleason grade of 4+3 or higher, P > .99.

