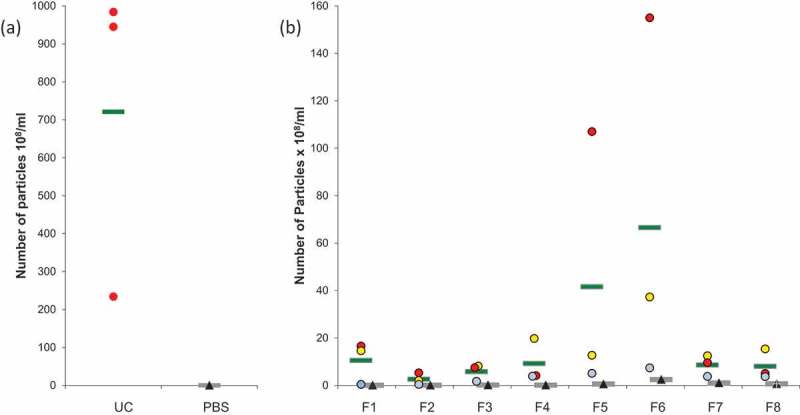
Figure 2.

Nanoparticle Tracking Analysis (NTA) on microglial EVs. (a) Particles from UC samples (red dots) were quantified. Vehicle PBS (black triangles) was used as negative control. (b) Particles counting in ODG fractions F1 to F8 for each replicates (blue, red, and yellow dots) were compared to OptiprepTM gradient fractions processed in the same way as control (black triangles). Each circle or triangle represents an individual count. Green and grey bars indicate the average for EVs or control fractions, respectively.
