
Figure 4.
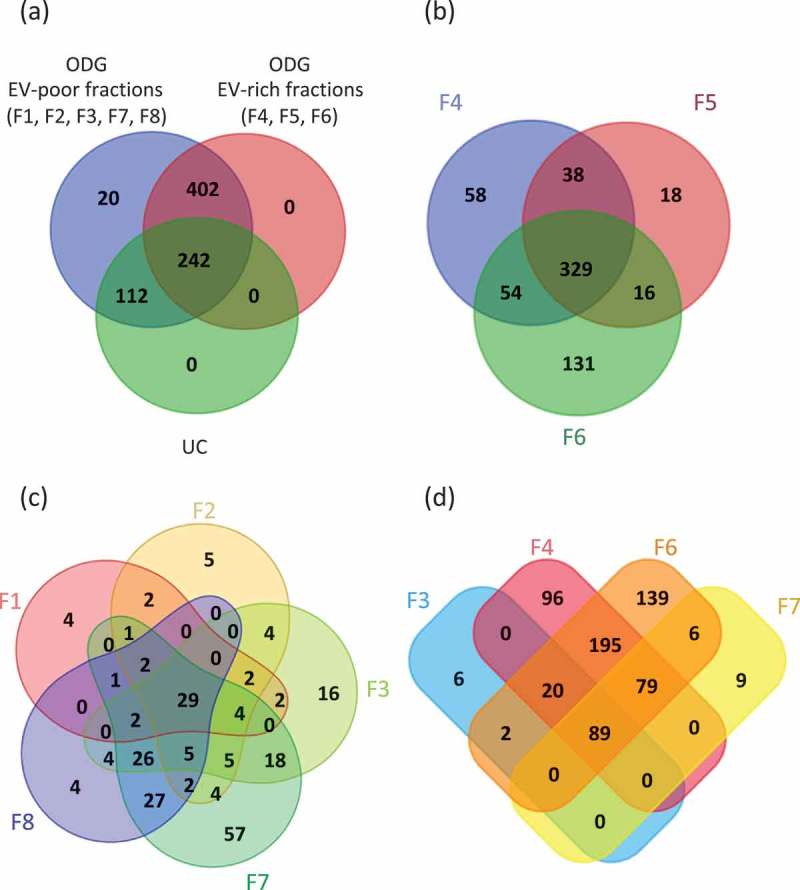
Venn’s diagrams of unique and shared proteins identified in UC and ODG samples. (a) Comparison between UC, ODG EV-rich (F4, F5, F6) and ODG EV-poor (F1, F2, F3, F7, F8) fractions. (b) Number of proteins identified in ODG EV-rich fraction F4, F5 and F6. (c) Unique and shared proteins identified in ODG EV-poor fractions F1, F2, F3, F7 and F8. (d) Proteins overlap between fractions (F3, F7) physically close to the EV-rich ones (F4 and F6).