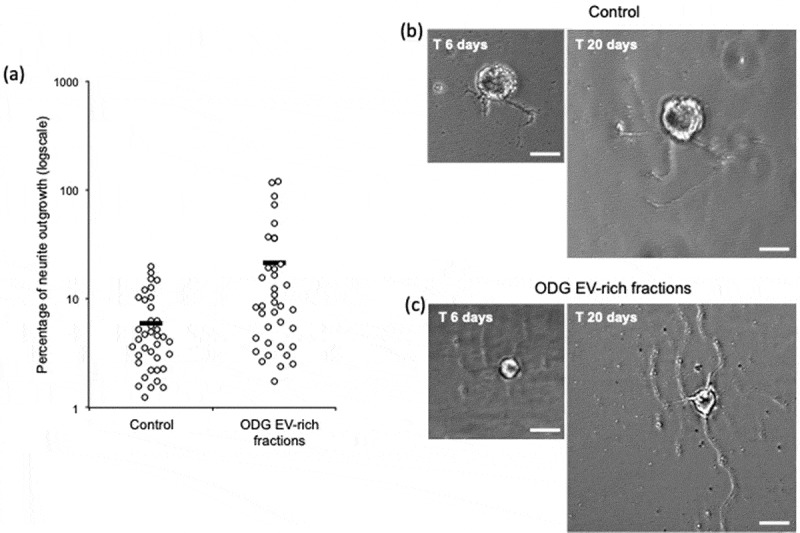
Figure 6.

In vitro assays for EVs neurotrophic activity assessment of ODG purified EVs. (a) Outgrowth measurements of leech neurons exposed for 14 days to complete medium (Control, n = 38) or to vesicles from ODG EV-rich fractions (n = 37). Each open circle represents the percentage of neurite outgrowth from individual neurons. Bars indicate the average values for each series of measurements. A significant difference was observed between the two conditions with a p-value of 0.0029. (b) and (c) pictures display an example of neurite outrgrowth recorded for the same neurone at 6 and 20 days of culture with L15 medium alone (Control) or containing 106 EVs/well (ODG EV-rich fractions). Scale bars correspond to 20 µm.
