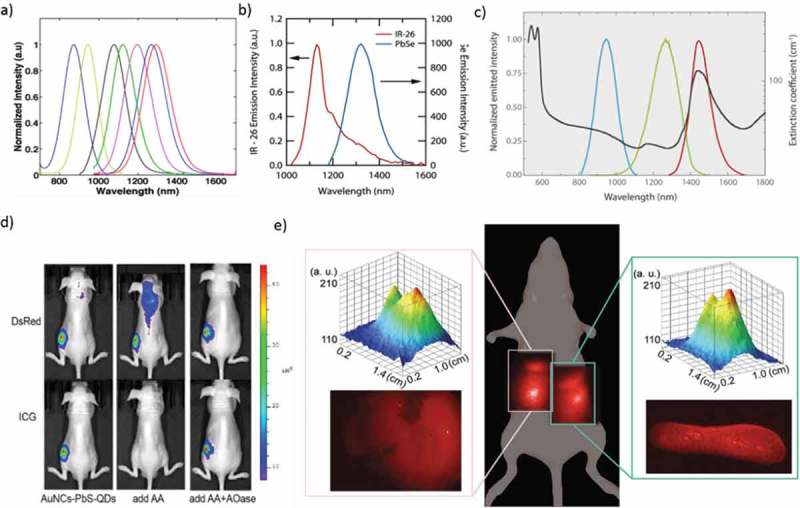
Figure 3.

(a) PL spectra of the PbS QDs synthesized by the droplet-based capillary reactor. (b) Comparison of relative PL spectra for IR-26 and a 0.98 eV PbSe QD. (c) The spectral range of different PbS/CdS/ZnS QDs. (d) The nude mice injected with AuNCs-PbS-QDs, AuNCs-PbS-QDs/AA, and AuNCs-PbS-QDs/AA/AOase, respectively. All the images were taken under two filters of DsRed and ICG. (e) Whole body and corresponding intensity surface, and ex vivo NIR fluorescence images of the liver (left inset) and spleen (right inset) of a mouse 24 h after tail vein injection of LNH2 capped QDs. Reproduced with permission from (Figure 3(a), [33] Copyright 2014 The American Chemical Society; Figure 3(b), [32] Copyright 2010 The American Chemical Society; Figure 3(c), [39] Copyright 2015 Wiley Publishing; Figure 3(d), [38] Copyright 2015 The American Chemical Society; and Figure 3(e), [45] Copyright 2018 RSC Publishing).
