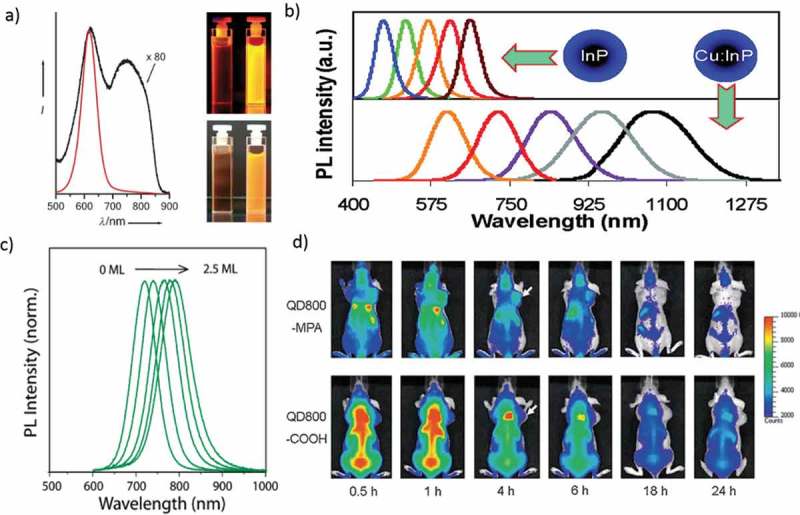
Figure 6.

(a) PL spectra of InP QDs grown at 250 °C for 4 h before (black line) and after (red line) HF etching. Photographs of both colloidal solutions under UV illumination (inset top-366 nm) and UV/white light flash (inset bottom). (b) PL spectra of differently sized InP QDs and Cu: InP d-dots (c) PL of InAs (Zn0.7Cd0.3S) during shell growth from 0–2.5 monolayers. (d) In vivo, NIR fluorescence imaging of 22B tumor-bearing mice (arrows) injected with QD800-MPA and QD800-COOH, respectively. Reproduced with permission from (Figure 6(a), [83] Copyright 2008 Wiley Publishing; Figure 6(b), [81] Copyright 2014 The American Chemical Society; Figure 6(c), [82] Copyright 2010 The American Chemical Society; and Figure 6(d), [ 85] Copyright 2010 Wiley Publishing).
