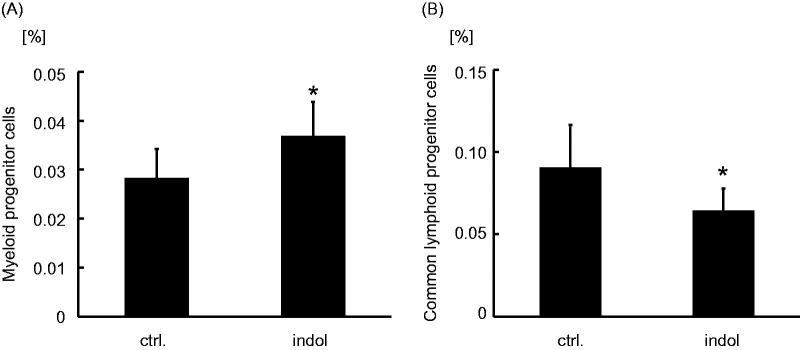
Figure 5.
Myeloid progenitor cells and common lymphoid progenitor cells expression in bone marrow cells of indol-administered mice. The relative frequency of (A) myeloid progenitor cells and (B) common lymphoid progenitor cells in bone marrow of the control group and the indol-administration group, which are abbreviated as ctrl. and indol, respectively. *p < 0.001 vs. the control group.

