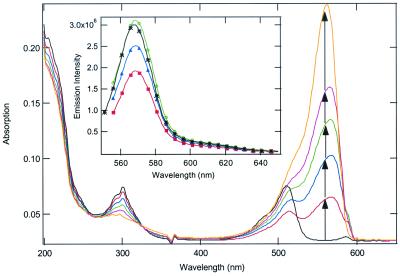
Figure 4.
Absorption spectra showing adsorption of 1 (17.2 μM/1.2% methanol in water) onto Laponite clay nanoparticles: black curve is starting mixture of monomeric 1 and J aggregate microcrystals. Successive curves (follow arrows) show spectral changes occurring on successive addition of microgram portions of Laponite nanoparticles. (Inset) Quench–unquench experiments of Laponite-supported 1 J aggregate in water. Black curve is starting emission from nanoparticles in water; red curve is emission quenched by the addition of 100 nM V-B+; blue and green curves show recovery on successive additions of 25 nM avidin.

