
Figure 5.
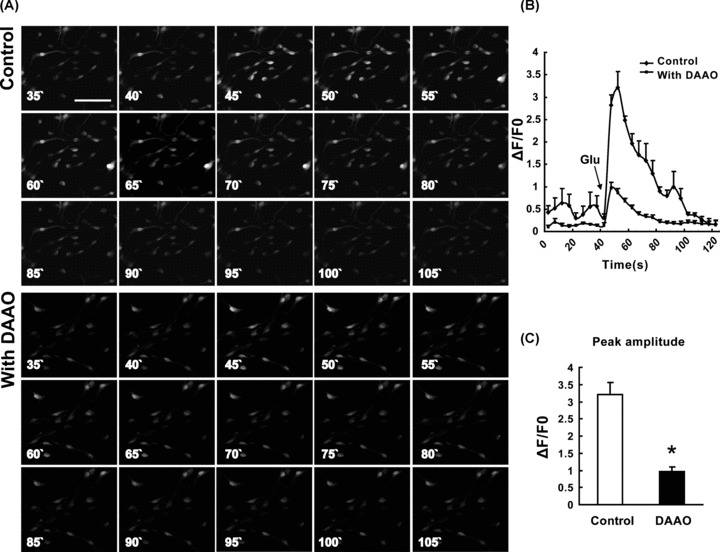
Effect of dAAO on the Ca2+ transient induced by glutamate. Sequence of images recorded over 90 seconds from control and dAAO group NSCs loaded with fluo‐3 AM following glutamate‐induced depolarization (A). Fluo‐3 fluorescence expressed as ΔF/F0; increased fluorescence indicates elevated [Ca2+]i. There was a significant inhibition of peak amplitudes in dAAO group compared with control group (B). Peak amplitudes of the glutamate‐induced Ca2+ transient show a significant decrease by preincubation with dAAO (C). n = 3. *P < 0.01 as compared with the control group. Scale bar = 50 μM.