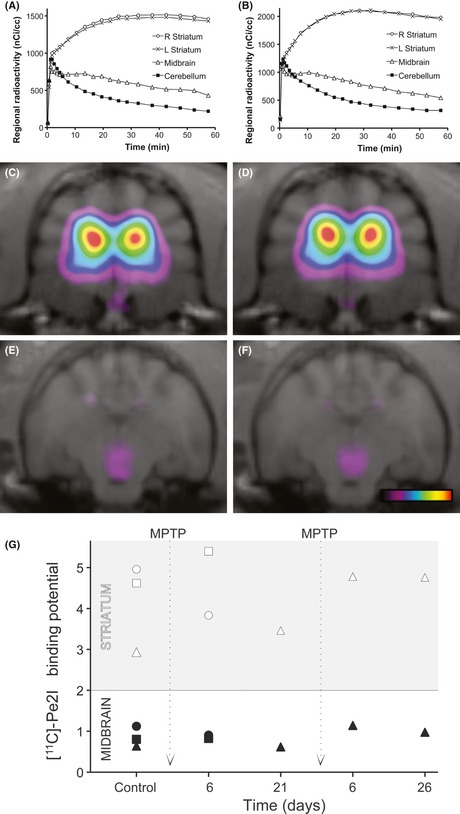
Figure 2.

The time–activity curves (in A and B) are the sum of 11C‐PE2I binding in the striatum and cerebellum before (A) and after 1 week of daily injections of 1‐methyl‐4‐phenyl‐1,2,3,6‐tetrahydropyridine (MPTP) (B) in the same three cats. Regional radioactivity is expressed in nCi/cc. C, E and D, F are color‐coded parametric images representing 11C‐PE2I BP in the striatum and midbrain, as described in materials and methods, before and after 1 week of MPTP treatment, respectively. Pseudocolor scale ranges from 0.5 to 6.
