
Figure 3.
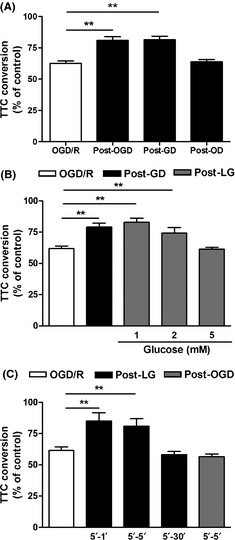
Effects of postconditioning with oxygen‐glucose deprivation (OGD), glucose deprivation (GD), oxygen deprivation (OD) and low glucose on OGD/reperfusion‐induced injury. (A) Corticostriatal slices were postconditioned with OGD, GD or OD for 1 min at 5 min after 15 min of OGD, and 1 h later slice injury was assessed by TTC conversion. (B) The concentration response of low‐glucose postconditioning. Zero, 1, 2 or 5 mmol/L glucose postconditioning was applied for 1 min at 5 min after 15 min of OGD. (C) The time‐course of low‐glucose postconditioning. One, 5, or 30‐min of 1 mmol/L glucose postconditioning was applied at 5 min after 15 min of OGD, and 5 min of OGD postconditioning was applied at the same time point simultaneously. Data are expressed as percentage of TTC conversion compared with control. Bars represent the mean ± SEM (n = 4–5), **P < 0.01. OGD/R, OGD/reperfusion; Post‐OGD, OGD postconditioning; Post‐GD, GD postconditioning; Post‐LG, low‐glucose postconditioning; Post‐OD, OD postconditioning.