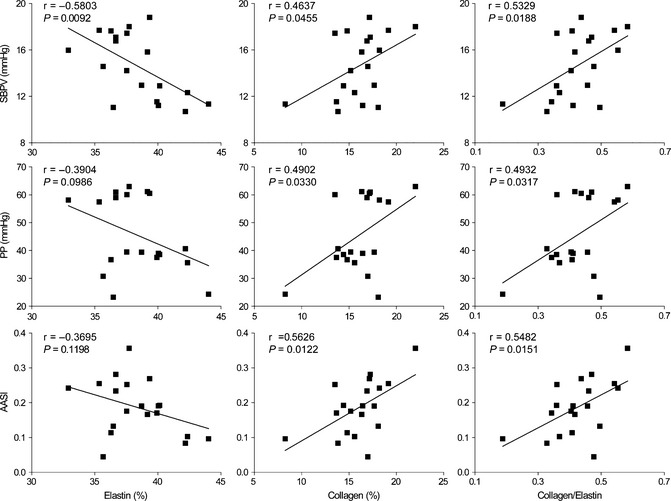
Figure 4.

Representative scatter plots showing the relationships between aortic components and hemodynamic parameters in Wistar–Kyoto and spontaneously hypertensive rats (n = 19). SBPV, systolic blood pressure variability; PP, pulse pressure; AASI, ambulatory arterial stiffness index.
