
Figure 4.
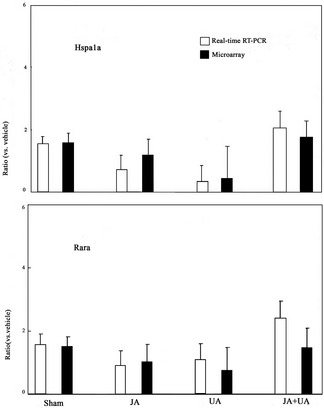
Independent experiments to identify gene expression using real‐time polymerase chain reaction (RT‐PCR). The expression of Hspa1a and Rarα in real‐time RT‐PCR compared with that in microarray. Values are the mean ± SD.
Official websites use .gov
A
.gov website belongs to an official
government organization in the United States.
Secure .gov websites use HTTPS
A lock (
) or https:// means you've safely
connected to the .gov website. Share sensitive
information only on official, secure websites.
Independent experiments to identify gene expression using real‐time polymerase chain reaction (RT‐PCR). The expression of Hspa1a and Rarα in real‐time RT‐PCR compared with that in microarray. Values are the mean ± SD.