
Figure 3.
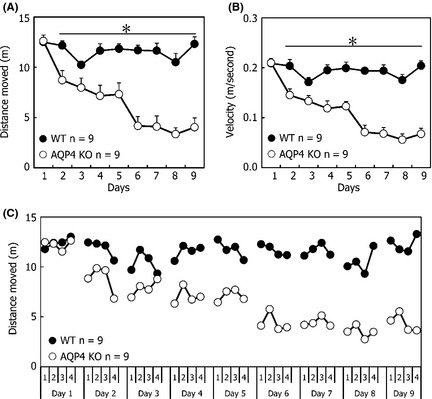
Performance using nonplatform training, as assessed by distance moved (A), swim velocity (B), and trial‐by‐trial learning curves (C) during nine training days. Each point represents the mean (±SEM) for four trials in each group. *P < 0.05 indicated significant post hoc differences (Tukey's test) between wild‐type (WT) mice and knockout (KO) mice.