
Figure 2.
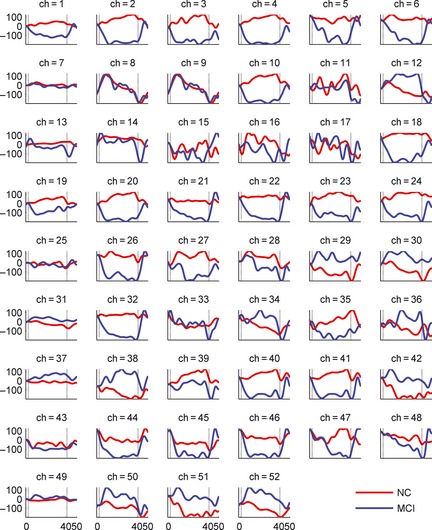
Grand‐average waveforms of oxy‐Hb concentration changes in 52 measurement channels during n‐back. The horizontal axis in each graph expresses the block time (s), and the vertical axis expresses hemoglobin concentration change (mM mm). The start time of the stimulation period was defined as 0 s. The red and blue lines express the averaged [Oxy‐Hb] changes in healthy controls (HC) and MCI, respectively.