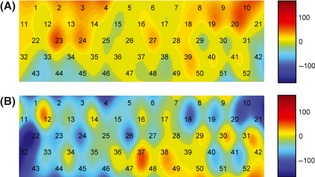
Figure 3.

Topographical images of [oxy‐Hb] concentration. (A) activation pattern of the healthy controls during the n‐back task. (B) activation pattern of the MCI patients during the n‐back task. The numbers in the image indicate the measurement channels.
