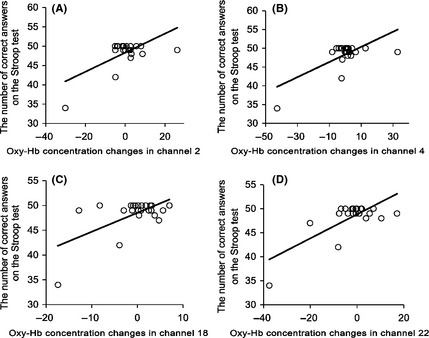
Figure 4.

The correlations between the number of correct answers on the Stroop test and the oxy‐Hb concentration changes in (A) channels 2, (B) channels 4, (C) channels 18, and (D) channels 22. The relationships were caused by strong correlations in (A) channel 2 (r = 0.643, P < 0.001), (B) channel 4 (r = 0.689, P < 0.001), (C) channel 18 (r = 0.613, P < 0.001), and (D) channel 22 (r = 0.740, P < 0.001).
