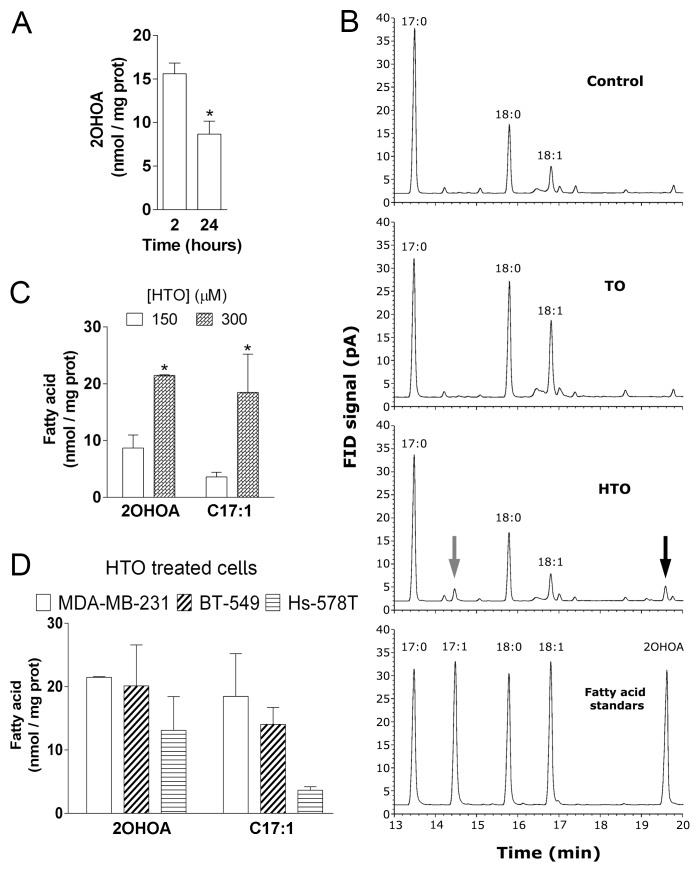
Figure 3. Effect of HTO and TO on membrane fatty acid composition in MDA-MB-231 cells.
MDA-MB-231 cells were maintained in the presence or absence of HTO (150 μM) for 2 or 24 h before their membranes were isolated and their lipids extracted. Fatty acid levels were quantified by GC and identified by comparison with standards. (A) The levels of 2OHOA in HTO treated cells. (B) Amplified region of representative chromatograms showing the fatty acid composition in MDA-MB231 cells treated with the vehicle alone (Control, upper panel), TO (second panel) or HTO (third panel). In cells exposed to HTO, the grey arrow indicates the peak corresponding to C17:1 and the black arrow corresponds to 2OHOA, as shown in the bottom panel (fatty acid standards). (C) Quantification of 2OHOA and C17:1 in MDA-MB-231 cells cultured in the presence of HTO (150 or 300 μM). (D) Quantification of 2OHOA and C17:1 in TNBC cells (MDA-MB-231, BT-549 and Hs-578T) cultured in the presence of 300 μM HTO: *p < 0.05.

