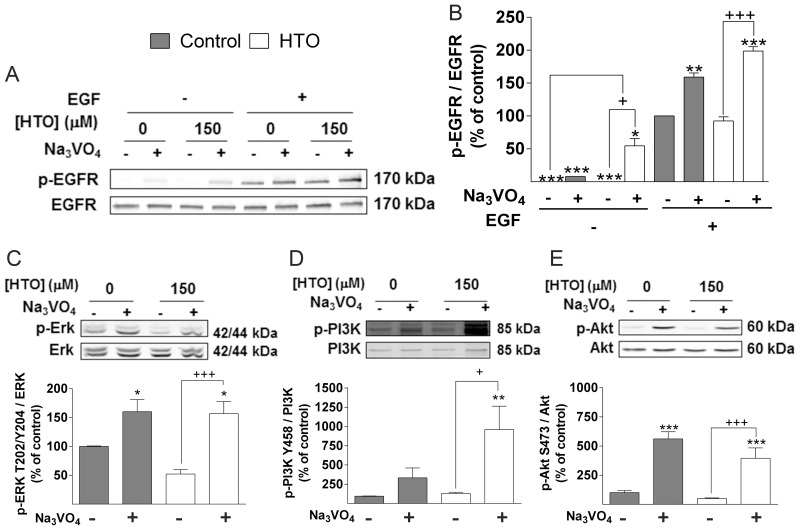
Figure 7. Effect of HTO on phosphatases.
MDA-MB-231 cells were serum starved, cultured in the presence or absence of HTO (150 μM) for 24 h and orthovanadate (100 nM) for 2 h before the cell lysates were prepared for immunoblotting (A–E). Cells were stimulated for 15 min with EGF (100 ng/ml) as appropriate (A-B) and the protein levels were determined by quantitative immunoblotting. Representative western blots are shown and the bars correspond to the mean ± SEM values of 3 independent experiments: */+p < 0.05, **p < 0.01, ***/+++p < 0.001.

