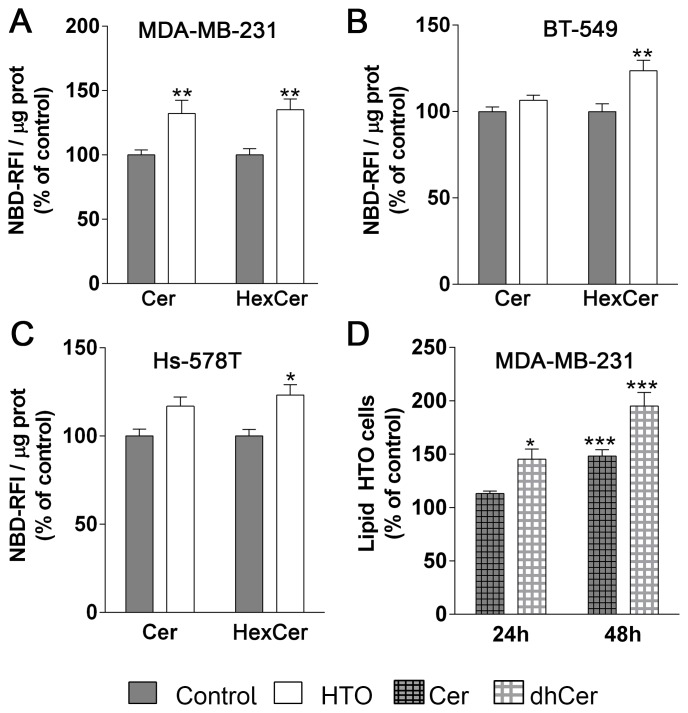
Figure 8. Effect of HTO on ceramide levels.
TNBC cells (MDA-MB-231, BT-549 and Hs-578T) were pre-treated for 24 h with HTO (200 μM) and then exposed to NBD-sphingomyelin (30 μM) for 3 h. Lipids were separated by TLC, and the plates were developed and scanned to detect and quantify the NBD-containing species. (A–C) The bars correspond to the mean ± SEM values of 3 independent experiments with duplicate samples: *p < 0.05, **p < 0.01 (ANOVA followed by Bonferroni’s test). (D) MDA-MB-231 cells were treated for 24 h with HTO (200 μM) and their lipids were then analyzed by HPLC-MS/MS. The bars correspond to the mean ± SEM values of 2–3 independent experiments: *p < 0.05, ***p < 0.001. Abbreviations: Cer, ceramide; HexCer, hexosylceramide; dhCer, dihydroceramide.

