
Figure 3.
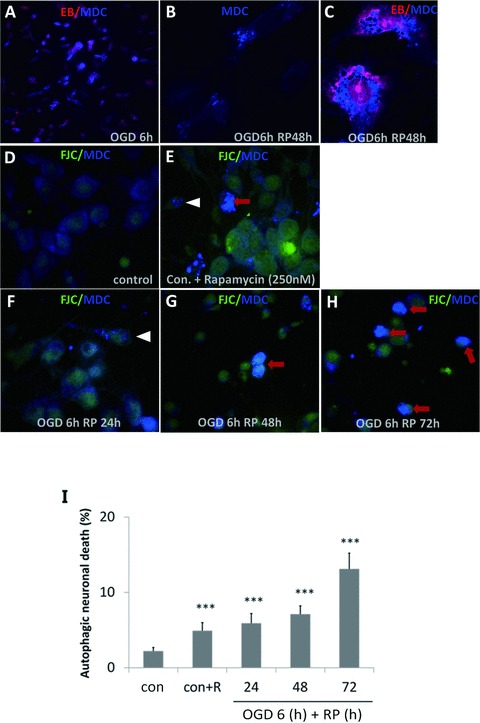
OGD/RP induces autophagic cell death in rat cortical neurons. Autophagic vacuoles (AVs) labeled by MDC appeared as distinct blue dot‐like structures distributed in the cytoplasm. Pictures were taken under 60× (A) and 100× magnification (B–C), when nuclei were stained by EB. MDC and Fluoro‐Jade C double‐staining was used to identify and quantify the autophagic neurons (white arrowheads) and autophagic neuron death (red arrows) under 40× magnification, D–H were representative pictures showing the different morphology under 100× magnification. Quantification of autophagic neuronal death rate (I) in cortical neurons after 6‐h OGD followed by RP 24, 48, or 72 h, respectively. *P < 0.05, *P < 0.01, *P < 0.001 versus control without OGD/RP.