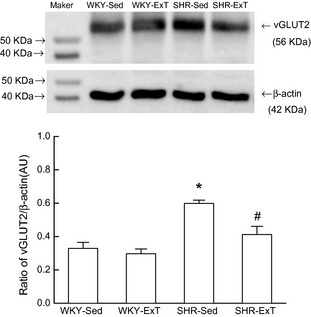
Figure 5.

Representative Western blot (top) and densitometric analysis (bottom) of vesicular glutamate transporter 2 (vGLUT2) in the rostral ventrolateral medulla of sedentary or exercised Wistar‐Kyoto (WKY) and spontaneously hypertensive rat (SHR) groups. AU, arbitrary unit. Values are mean ± SE; n = 5 in each group. *P < 0.05 versus WKY‐Sed; # P < 0.05 versus SHR‐Sed.
