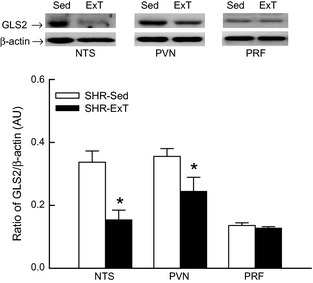
Figure 6.

Representative Western blot (top) and densitometric analysis (bottom) of glutaminase2 in the nucleus of solitary tract (NTS), paraventricular nucleus (PVN), and pontine reticular formation (PRF) in the Sed or ExT‐treated spontaneously hypertensive rat (SHR). AU, arbitrary unit. Data are mean ± SE; n = 5 in each group. *P < 0.05 versus SHR‐Sed.
