Figure 5.

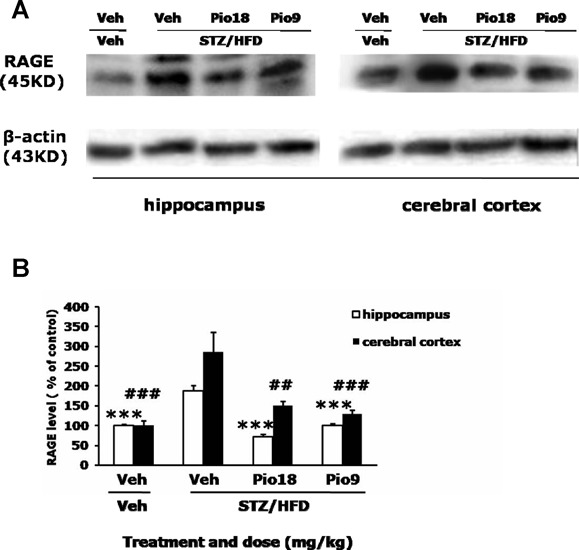
Effects of pioglitazone on RAGE content in the brain of STZ/HFD diabetic mice. Left‐panel is representative immunoblots of RAGE and β‐actin (inner control) measured by western bloting using respective antibodies in hippocampus, left‐panel is immunoblots in cerebral cortex (A). Quantification of RAGE is expressed as the ratio (in percentage) of control (B). ***P < 0.001 versus hippocampus of STZ/HFD+Veh group, ## P < 0.01, ### P < 0.001 versus cerebral cortex of STZ/HFD+Veh group.
