
Figure 1.
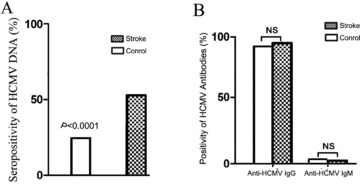
HCMV status in patients with stroke and controls. (A) Comparison of HCMV seropositivity in the stroke group versus the control group; P values calculated by chi‐square test. (B) Rate of anti‐HCMV IgG and anti‐HCMV IgM seropositivity in stroke patients and controls; P values were calculated by Fisher's exact test.