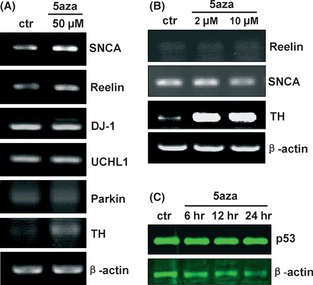
Figure 4.

Regulation of gene transcription and expression in 5‐aza‐dC–treated SH‐SY5Y cells. Semiquantitative RT‐PCR showing the mRNA levels of tyrosine hydroxylase (TH), α‐synuclein (SNCA), parkin, ubiquitin carboxy‐terminal esterase hydrolase L1 (UCHL1), DJ‐1, and reelin in SH‐SY5Y cells treated with 50 μM (A), 2 μM, or 10 μM (B) of 5‐aza‐dC for 24 h. Expression levels of p53 protein (C) in N27 cells treated with 5‐aza‐dC (5 μM) for 6, 12, or 24 h, as assessed by immunoblotting. 5aza, 5‐aza‐2′‐deoxycytidine.
