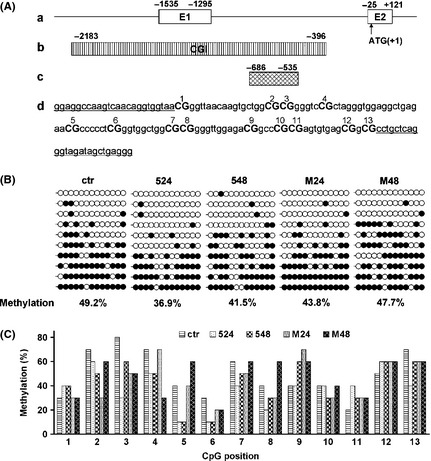
Figure 5.

Methylation status of CpG island in SNCA promoter region. (A) The CpG island at 5′ end of the interested SNCA region. (a) Schematic drawing of the five region of SNCA with exons 1 and 2 (boxes) and the five UTR and intron 1 (line). Numbers are relative to the translation start site (ATG 1). (b) CpG island (CGI) is depicted by the stripped box. (c) Fragments in CpG island were used for bisulfite sequencing. (d) Location of CpG dinucleotides (CpGs) in this fragments of CpG island. There are 13 CpGs in the CpG region. Each CpG is labeled with number. Sequences with under bar show primer locations of the bisulfite PCR. (B) Bisulfite sequence analysis of the CpG region. DNA was purified from SH‐SY5Y cells, and bisulfite sequence analysis was performed. At least 10 clones from each drug‐treated group were analyzed. Open circles indicate unmethylated CpGs, whereas closed circles indicate methylated CpGs. The degree of methylation was calculated as methylated CpG/total CpG and shown below (% methylation). (C) Detailed comparison of methylation at individual CpG sites. The degree of methylation at each CpG site was calculated as methylated CpG/total CpG. Total 10 clones per group were analyzed by bisulfite sequencing. ctr, control; 524, 5‐aza‐dC (50 μM) for 24 h; 548, 5‐aza‐dC (50 μM) for 48 h; M24, MPP + (400 μM) for 24 h; M48, MPP + (400 μM) for 48 h.
