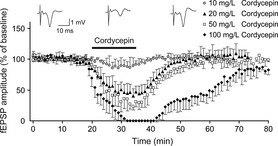
Figure 1.

Effects of cordycepin on fEPSPs elicited in the CA1 region by stimulation of the Schaffer‐commissural fibers. Sample traces (top) show fEPSPs recorded before, during, and after bath application of cordycepin (20 mg/L). The bottom graph shows time courses of the effects of different concentrations of cordycepin (10, 20, 50, and 100 mg/L) on the amplitude of fEPSPs. Note that in this and in the following figure, each data point in the graph plots, the average of the peak amplitudes of three concecutive fEPSPs and expressed as a percentage of basal values. Bath application of cordycepin is indicated by a horizontal bar.
